As summer draws to a close, we hope you all enjoyed some fun in the sun and you are ready to welcome the cooler weather as the leaves begin to fall!
Many of you have contacted us with helpful feedback, questions, suggestions, and compliments. Please continue to let us know what is working well and what needs improvement! Simply contact the team at hrar-notify@calists.harvard.edu.
Highlights
We are pleased to announce a new application called University Costing!
This application presents University-wide data about the workforce associated with distributed costing. The workforce effort is represented by the sum of the Distributed FTE for all active and paid appointments. My Costing
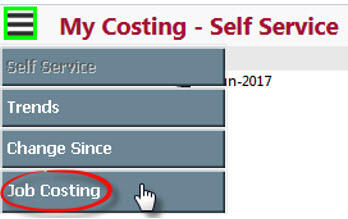
- There is now a "Change Since" chart included in My Costing which replicates the "Change Since" sheet in Workforce Analytics (change since Last Qtr, Last FY, Last Five FY, etc.). You’ll find this under the application menu:

- Comparison Change in Dist FTE and Comparison % Change in Dist FTE metrics have been added to Self Service

My Earnings
New Self Service Fields
Real Earnings Flag, Grossup Indicator and Target Amount have been added to Self Service under the Earnings Dimensions.
- Hourly Rate, Officer Code, and Officer Desc have been added to Self Service under the Job Dimensions
My Workforce and University Workforce
- Under the Current category, you will find a "Job Costing" report
-
The "Individual Job Profile" report for all jobs under Actions has been renamed "Career Summary"
- Additional job attributes have been added to the "Career Summary" chart
New Self Service Fields
- Officer Code and Officer Desc have been added to Self Service under the Job Dimensions
Newly Added to My Workforce
- Under the Point in Time category of reporting, you will now find a "Leave of Absence Analysis" report as well as an "Union Membership" report

Newly Added to University Workforce
- Under the Other category of reporting, you will now find an "All Jobs" report which allows users to view all jobs held by an employee across the University. It is intended to replace former CREW HR report HRJOBEE058 - Individual-University Job Profile.
 .
.
In an effort to enrich diversity reporting, we have made enhancements to the Diversity Scorecard:
- Headers now adjust to accommodate longer name reports
- Empl Class data is now ordered, for example, by:
Admin Prof -> Support Staff -> Service and Trades
- Leadership/grade data is now ordered, for example, by:
Grade 58 -> Mgmt -> Sr Mgmt -> Sr Leadership
- The Hire/Promotion/Termination charts have been enlarged to match the size of other charts
Workforce Analytics
- Absence Management has been updated with information through FY2017
Closed Requisitions
-
Source Category has been added to the Soure page:
- As a Chart
- Under the Self Servide Candidate Dimensions
- Source has been added to Filters

Open Requisitions
- Costing has been added to the Detail page and to Self-Service under the Req Dimensions

Work Life Programs
- Harvard Email has been added to the EAP and Care.com report
Benefits Demographics
- Added Calculated Employee Age, Age Bands and Age 55 Plus to Self-Service Person Dimensions
- Added Calculated Dependent Age and Dependent Age Band in Dependent Details
Training and Change Management
- You can now register for Introduction to QlikView class via the HTP! Hope to see you there!

- Drop-in Sessions are scheduled as follows at 124 Mt. Auburn St., 3rd Floor:

- Training materials are available on the Harvard Training Portal include video tutorials
Did You Know?
Did you Know...you can paste data into the search functionality within QlikView? It is super easy, saves you "click" time, but works best with numeric values.
1. Copy your data from an Excel spreadsheet or some other document:

2. In QlikView, go to "Additional Filters" on the application ribbon:
![]()
3. For this example, scroll down to the Dept ID list box and click the magnifying glass:

4. Delete the asterisks:

5. Paste (CTRL V) the values from Step 1 into the Search box.

6. You will now see your criteria in the Current Selections window:

7. Return to the reporting windows by clicking on the "Additional Filters" icon again and continue your analysis:
![]()
